Some background
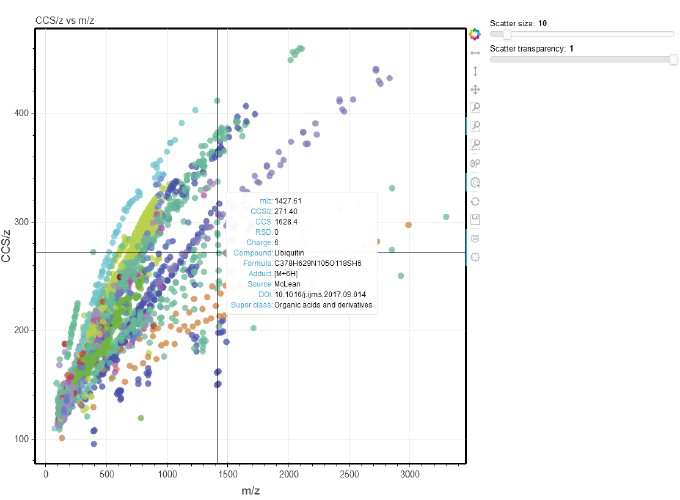
I recently came across this nice paper from John McLean’s lab at Vanderbilt which discusses how we can use a relatively large (~4000 values) database of measured standards in omics studies. They have created a R Shiny app which provides interactivity to explore the dataset. Since I have been recently improving ORIGAMI’s interactive capabilities, I’ve decided to embed their dataset in ORIGAMI and export it as a self-sufficient HTML document. This took me about ~10 minutes altogether (mostly rearranging columns and annotating text document). I think the results are quite close to the original publication (Figure 2a).
Interactive figure
Data structure
In order to implement this example, I’ve used ORIGAMI’s metadata format that provides straightforward access to load annotated data. You can look in the example available for download. The format of the metadata text files is still not finalised, however, it contains several columns that permit ORIGAMI to figure out how to plot the data. Tags used in this example include:
Column tags:
axis_x, axis_y, axis_label, axis_url, axis_color
Header tags:
title, plot_type, x_label, y_label, hover_labels.
You can have a look at the way the data is structured below.
Download formatted data:
You can download the data used for this figure from here
Last updated: 2/1/2019